
If Rachel Reeves Had to Publish the Productivity Wage Quotient for the UK Economy… What Would It Say?
Why business leaders must stop measuring the wrong thing in 2026
Make it stand out
Whatever it is, the way you tell your story online can make all the difference.
In her 2025 Budget speech[1], Rachel Reeves delivered two headlines that — on the surface — made absolutely no sense together.
On the one hand she shared that the OBR has
“…upgraded Britain’s growth for this year from 1% to 1.5%.”
And in the next breath she shared that the OBR
“…are reducing their expectations for productivity growth by 0.3ppts to 1% by the end of the forecast.”
To most people, this sounds paradoxical. How can the economy be growing faster if the value created per worker is expected to grow slower?
It turns out this paradox is more than an economic quirk. It is a cautionary tale for business leaders, especially those planning New Year strategy kick-offs and setting performance targets for 2026.
Because what Rachel Reeves revealed — perhaps unintentionally — is the danger of measuring the wrong things and believing you’re doing better than you truly are.
And businesses fall into exactly the same trap.
The difference between GDP and real value creation
Much of my work focuses on productivity, which is officially defined by economists as Gross Value Added (GVA) per worker.
GVA represents:
Wages and salaries
Profit before tax
Depreciation
In simple terms, it is the value your organisation adds through people, processes and capability.
GDP, however, can be calculated in several ways[2]. The version relevant here is:
GDP = GVA + taxes on products + taxes on production – subsidies
This means GDP includes things that make the economy look bigger — even if we haven’t created more value.
These include:
Employer NIC (tax on production)
Business rates
Fuel duty
Alcohol and tobacco duties
Import duties
VAT-type product taxes
Reduced subsidy levels
So if GDP is predicted to rise by 1.5% and GVA only by 1%, the simple truth is this:
The extra 0.5% is coming from taxes, not productivity.
This sounds absurd. And yet businesses do it every day.
The corporate equivalent of the “GDP illusion”
Most CEOs proudly present top-line figures at the start of the year:
Revenue
Pipeline
Market share
Headcount
EBITDA uplift
These numbers look healthy. They flatter. They create a sense of progress.
But they often mask declining value added per person — the real engine of profitability.
It’s the corporate equivalent of the Government claiming strong GDP while productivity falls.
You can always inflate GDP by raising taxes.
And in companies, headline results can rise even when underlying performance doesn’t, for example when:
• Pipeline grows in value but not in quality or probability.
• Revenue increases because prices were raised, not because more value was created
• Headcount grows faster than capability.
• Activity expands — more meetings, more projects, more tasks — without increasing value
• Gross margin rises through cost cuts, not operational improvement.
• Customer numbers go up but profitability per customer goes down
• Projects hit their milestones even though benefits never materialise
• Budget spend tracks to plan, even if the spend contributes little to future value
None of these increases value added. They just make the headline number bigger.
Exactly like GDP.
And nothing in these manoeuvres makes you more productive, more sustainable, or more competitive.
The number leaders should care about: Productivity per person
When I work with clients, I help them calculate two essential metrics:
1. Value Added per Person (your internal equivalent of GVA per worker)
2. The Productivity Wage Quotient (PWQ)
PWQ measures the relationship between:
Value added created by the organisation, and
The investment made in wages and salaries.
It tells you the return on your people investment — the truest indicator of organisational productivity.
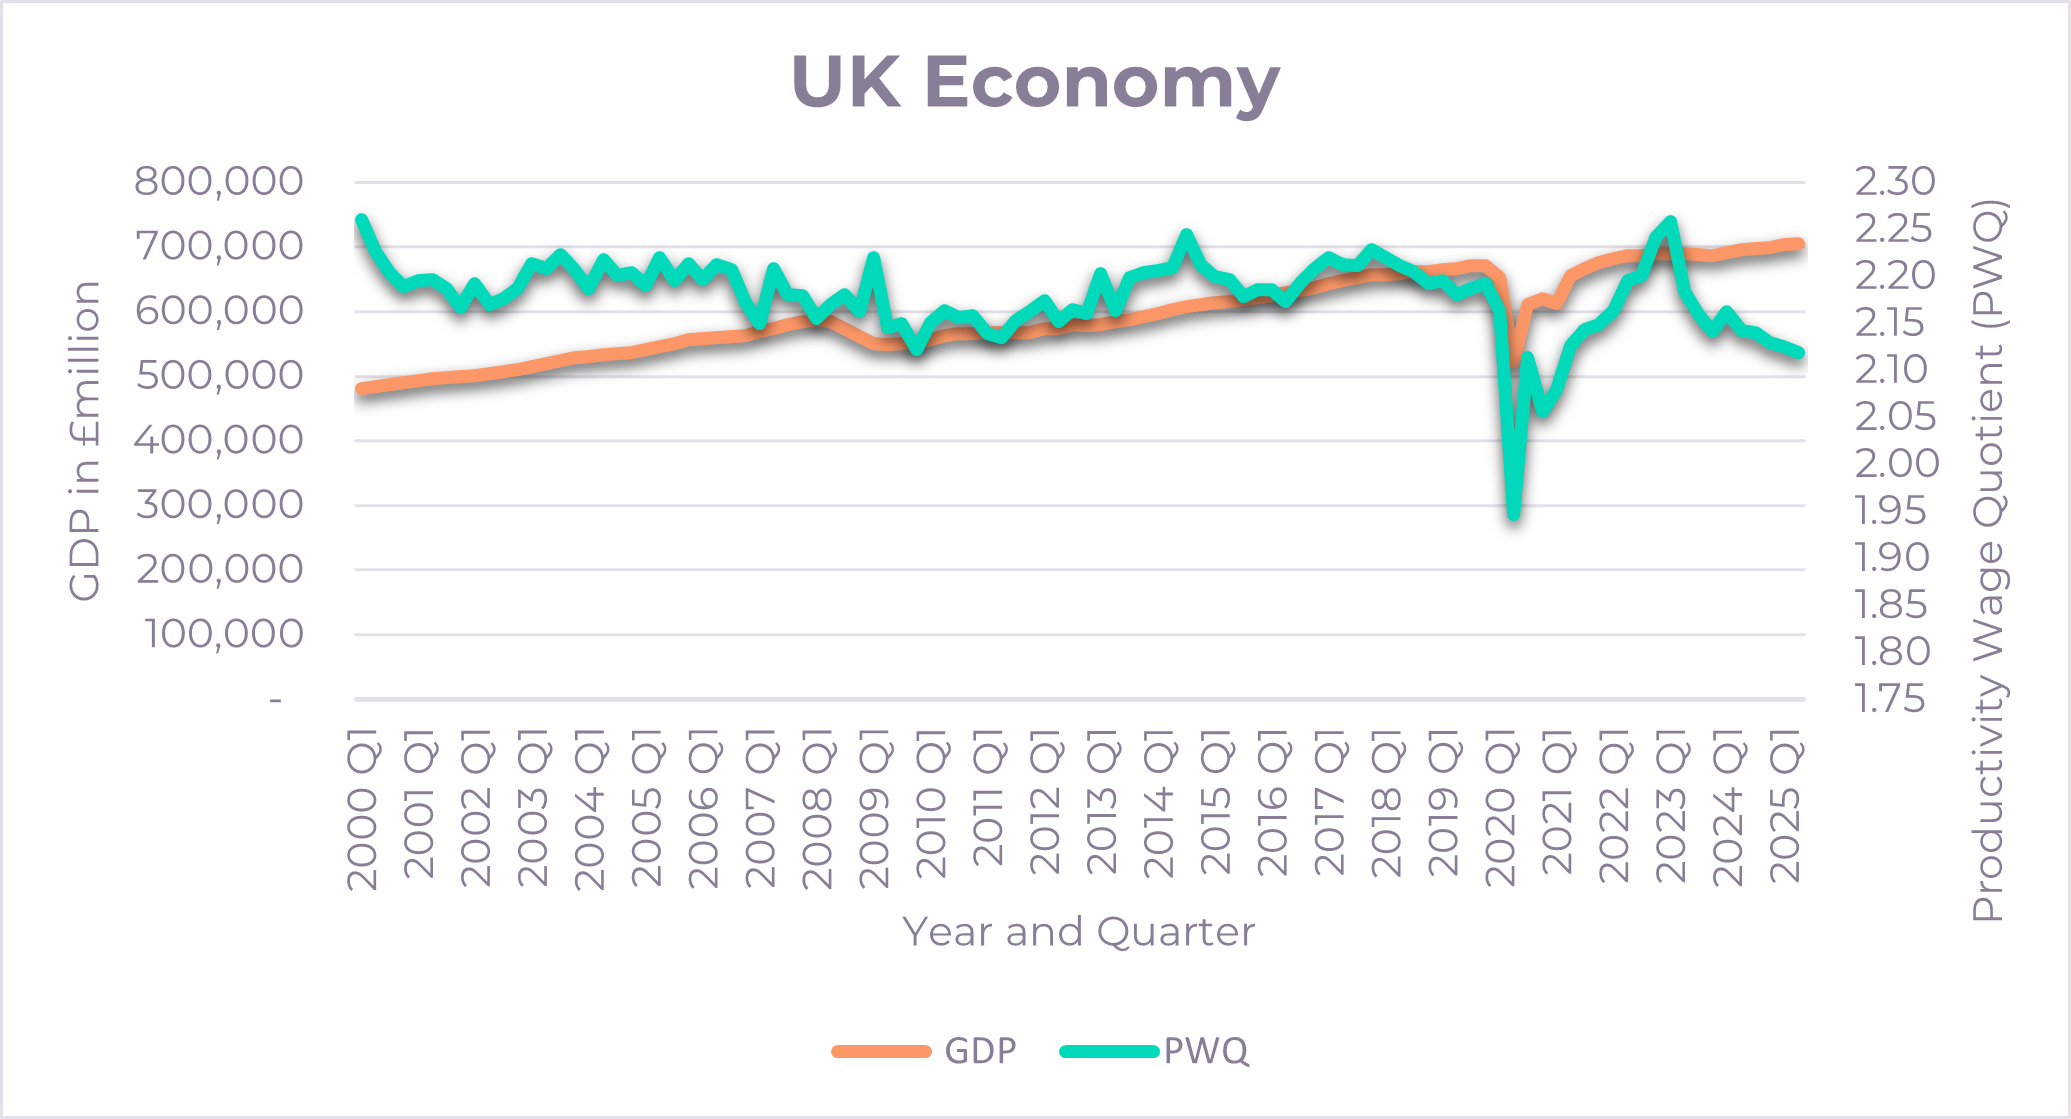
Using ONS data, I’ve calculated the PWQ for the UK economy since 2000.
Source: ONS
In Q1 2020, the UK PWQ was:
2.26 — meaning every £1 of wages generated £2.26 of value added and £1.26 of surplus.
Today, based on the latest data (Q2 2025), it has fallen to:
2.12 — a visible decline in the return on labour investment.
And it gets worse.
Across the firms I’ve assessed, 80% have a PWQ below 1.7 — a line so low it hardly registers on the national graph.
In other words:
Most organisations are generating far less value per person than they think.
They are working harder… for less money.
Just like the UK economy.
Why this matters for business kick-offs and 2026 strategy
As your leadership team prepares for January offsites, town halls, and strategy resets, be mindful:
You may be celebrating your company’s “GDP numbers” when the real story is in your GVA per worker.
• Revenue can be up while value added per person is falling.
• EBITDA can be steady while productivity is eroding.
• Headcount can rise while efficiency collapses.
• Market share can look stable while margin disappears.
This is exactly the paradox Rachel Reeves highlighted at a national level — and it is happening inside companies too.
The call to action: Measure what actually matters
In 2026, business leaders need to ask sharper questions:
How much value are we creating per person?
Is that number improving, flat or declining?
What is our PWQ — and is it rising or falling?
Are we growing by getting better, or simply by adding more people?
Are our “GDP numbers” masking deeper productivity problems?
Because just as the UK cannot tax its way to prosperity, your organisation cannot revenue-inflate its way to meaningful performance.
“I contend that for a nation to try to tax itself into prosperity is like a man standing in a bucket and trying to lift himself up by the handle.” – Winston Churchill
You can only get there through:
• Better ways of working
• A strong brand promise
• Stronger alignment
• A strong focus on the commercials
• A productive rather than lethargic culture
• And ultimately: improved productivity per worker
Final thought
If Rachel Reeves had to stand up and publish the PWQ of the UK economy, it would show a slow, steady decline — evidence that despite the headlines, we are creating less value per person over time.
If you had to publish your organisation’s PWQ to your employees or investors, what story would it tell?
And is it time to change the narrative before the next financial year begins?
[1] https://www.gov.uk/government/speeches/budget-2025-speech
I’m Amanda Sokell. I speak at conferences and leadership events about organisational productivity and the culture shifts that unlock it. Through facilitation and coaching, I help leaders turn productivity from an agenda item into a way of working - building teams that deliver more value, with less friction. If you’re looking for an engaging speaker or facilitator to spark a different conversation about productivity in your organisation, let’s talk. www.amandasokell.com
I’m Amanda Sokell. I speak at conferences and leadership events about organisational productivity and the culture shifts that unlock it. Through facilitation and coaching, I help leaders turn productivity from an agenda item into a way of working - building teams that deliver more value, with less friction. If you’re looking for an engaging speaker or facilitator to spark a different conversation about productivity in your organisation, let’s talk.